Right click your project, and then click Debug
As -> Debug Configurations.
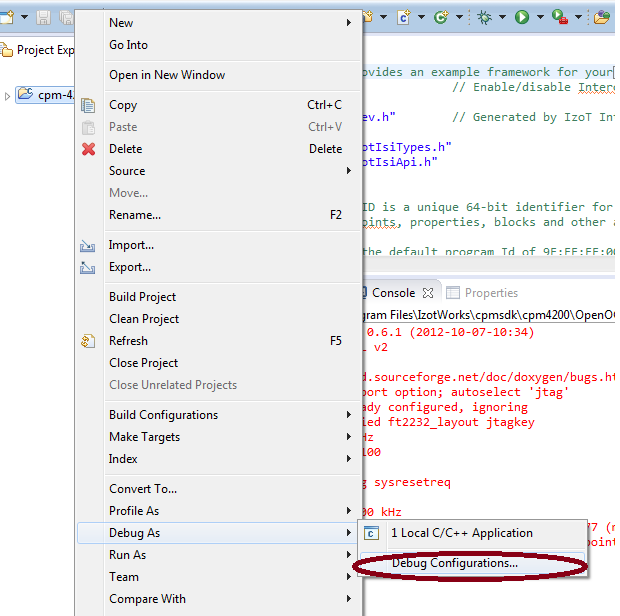
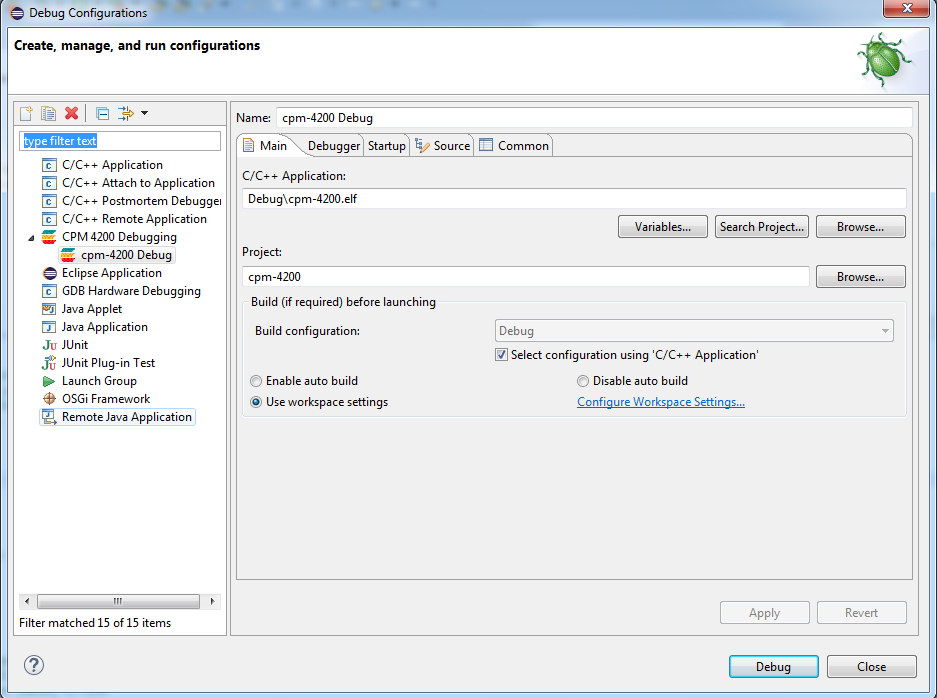
You can use the Eclipse source-level debugger to debug your CPM 4200 Wi-Fi applications. To use the debugger, you must first create a debug configuration . You only have to do this once for each new project. If multiple debug configurations are available, be sure to select the relevant one for your project. To create a debug configuration, follow these steps:
Right click your project, and then click Debug
As -> Debug Configurations.
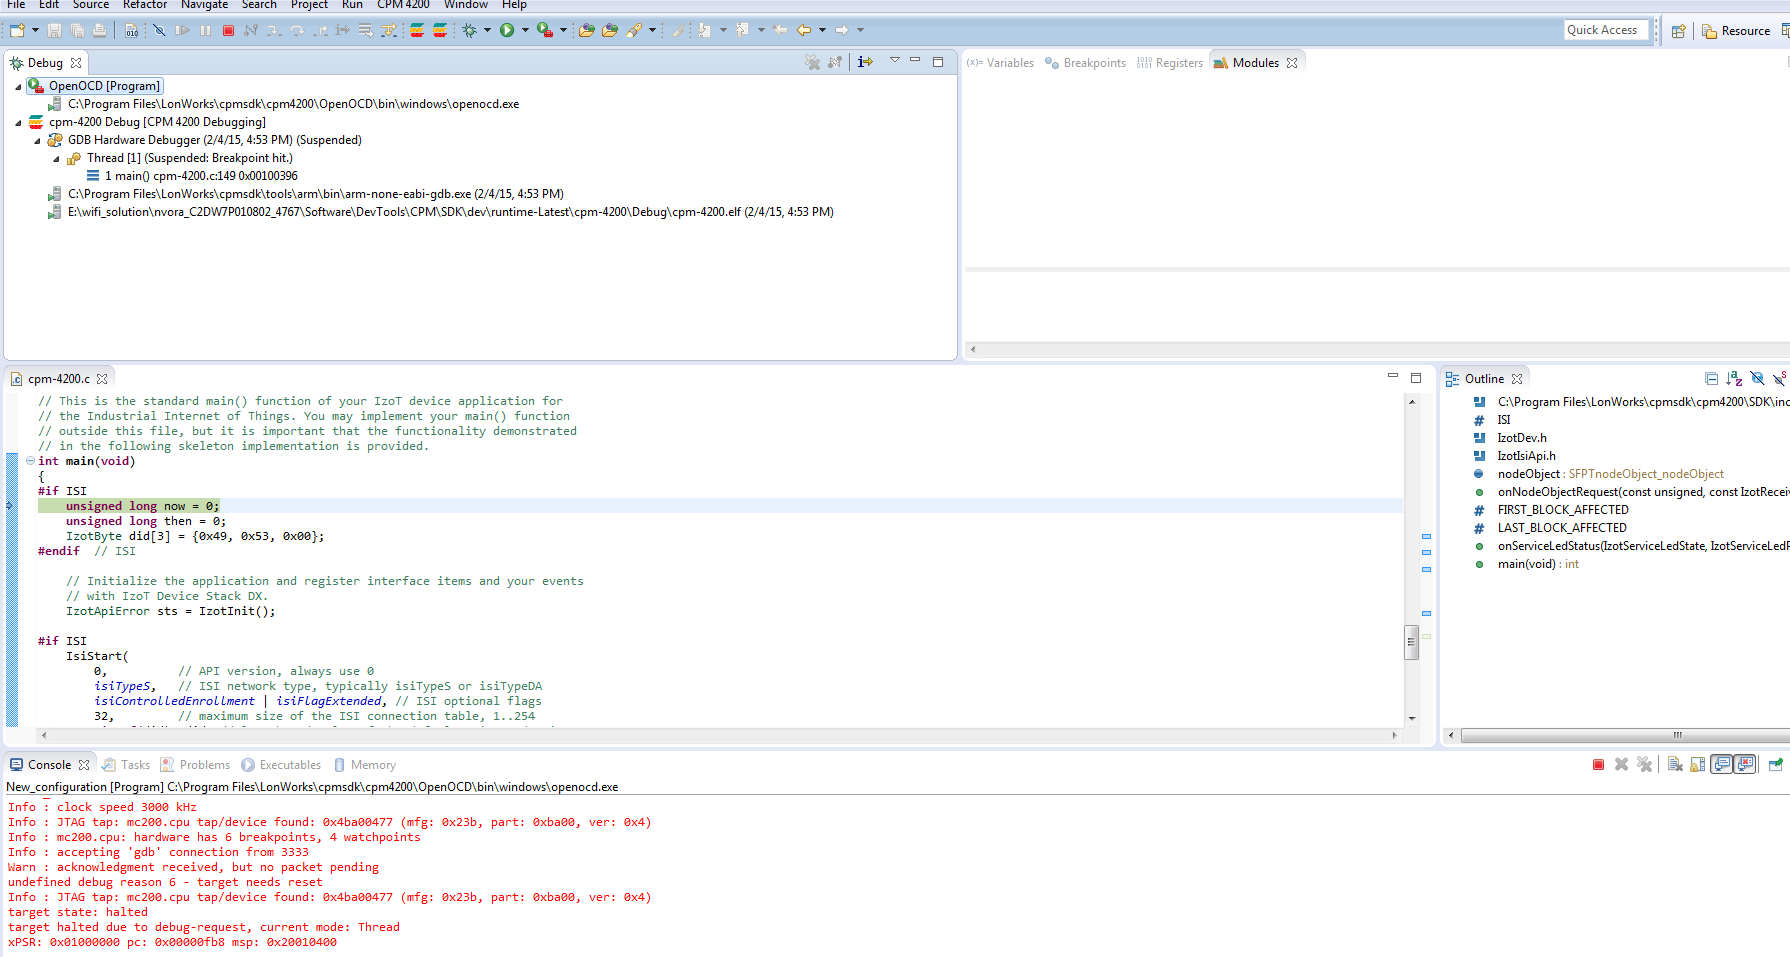
To stop the application running again, click the red terminate button or set a breakpoint. You can set up to six breakpoints and four watchpoints.
To restart debugging, click the arrow next to the green debug button and select your debug configuration. Do not click the Debug button again.